Aruba’s New Network Sensor

Aruba UXI Sensor
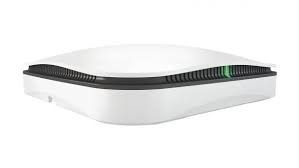
In early 2018, Aruba announced they were buying Cape networks, the developers of the Cape sensor. Rebranded as the Aruba User Experience Insight (UXI), the sensor sits on your network. It alerts you whenever your network is having problems.
It may not seem like much, but it is an amazing little device that could help IT departments everywhere. When deployed, the Aruba UXI sensor acts like a user on your network, except much smarter. No more complaints about “the internet isn’t working”. Instead, you get personalized alerts telling you exactly what is going wrong. Whether that means DNS is unresponsive, or merely yahoo.com is having an outage.

The sensor is designed to work straight out of the box on any network. It just needs to be registered to a dashboard. Then give credentials to the wifi or plug it into the ethernet. It takes so little set up. It can be mailed to a remote site and set up by anyone. All configuration is done in the web portal. All standard tests and alert thresholds come preconfigured. No set up is even needed, though you can definitely still customize it.
Aruba UXI Overview from Aruba Networks / Cape on Vimeo.
Aruba Dashboard

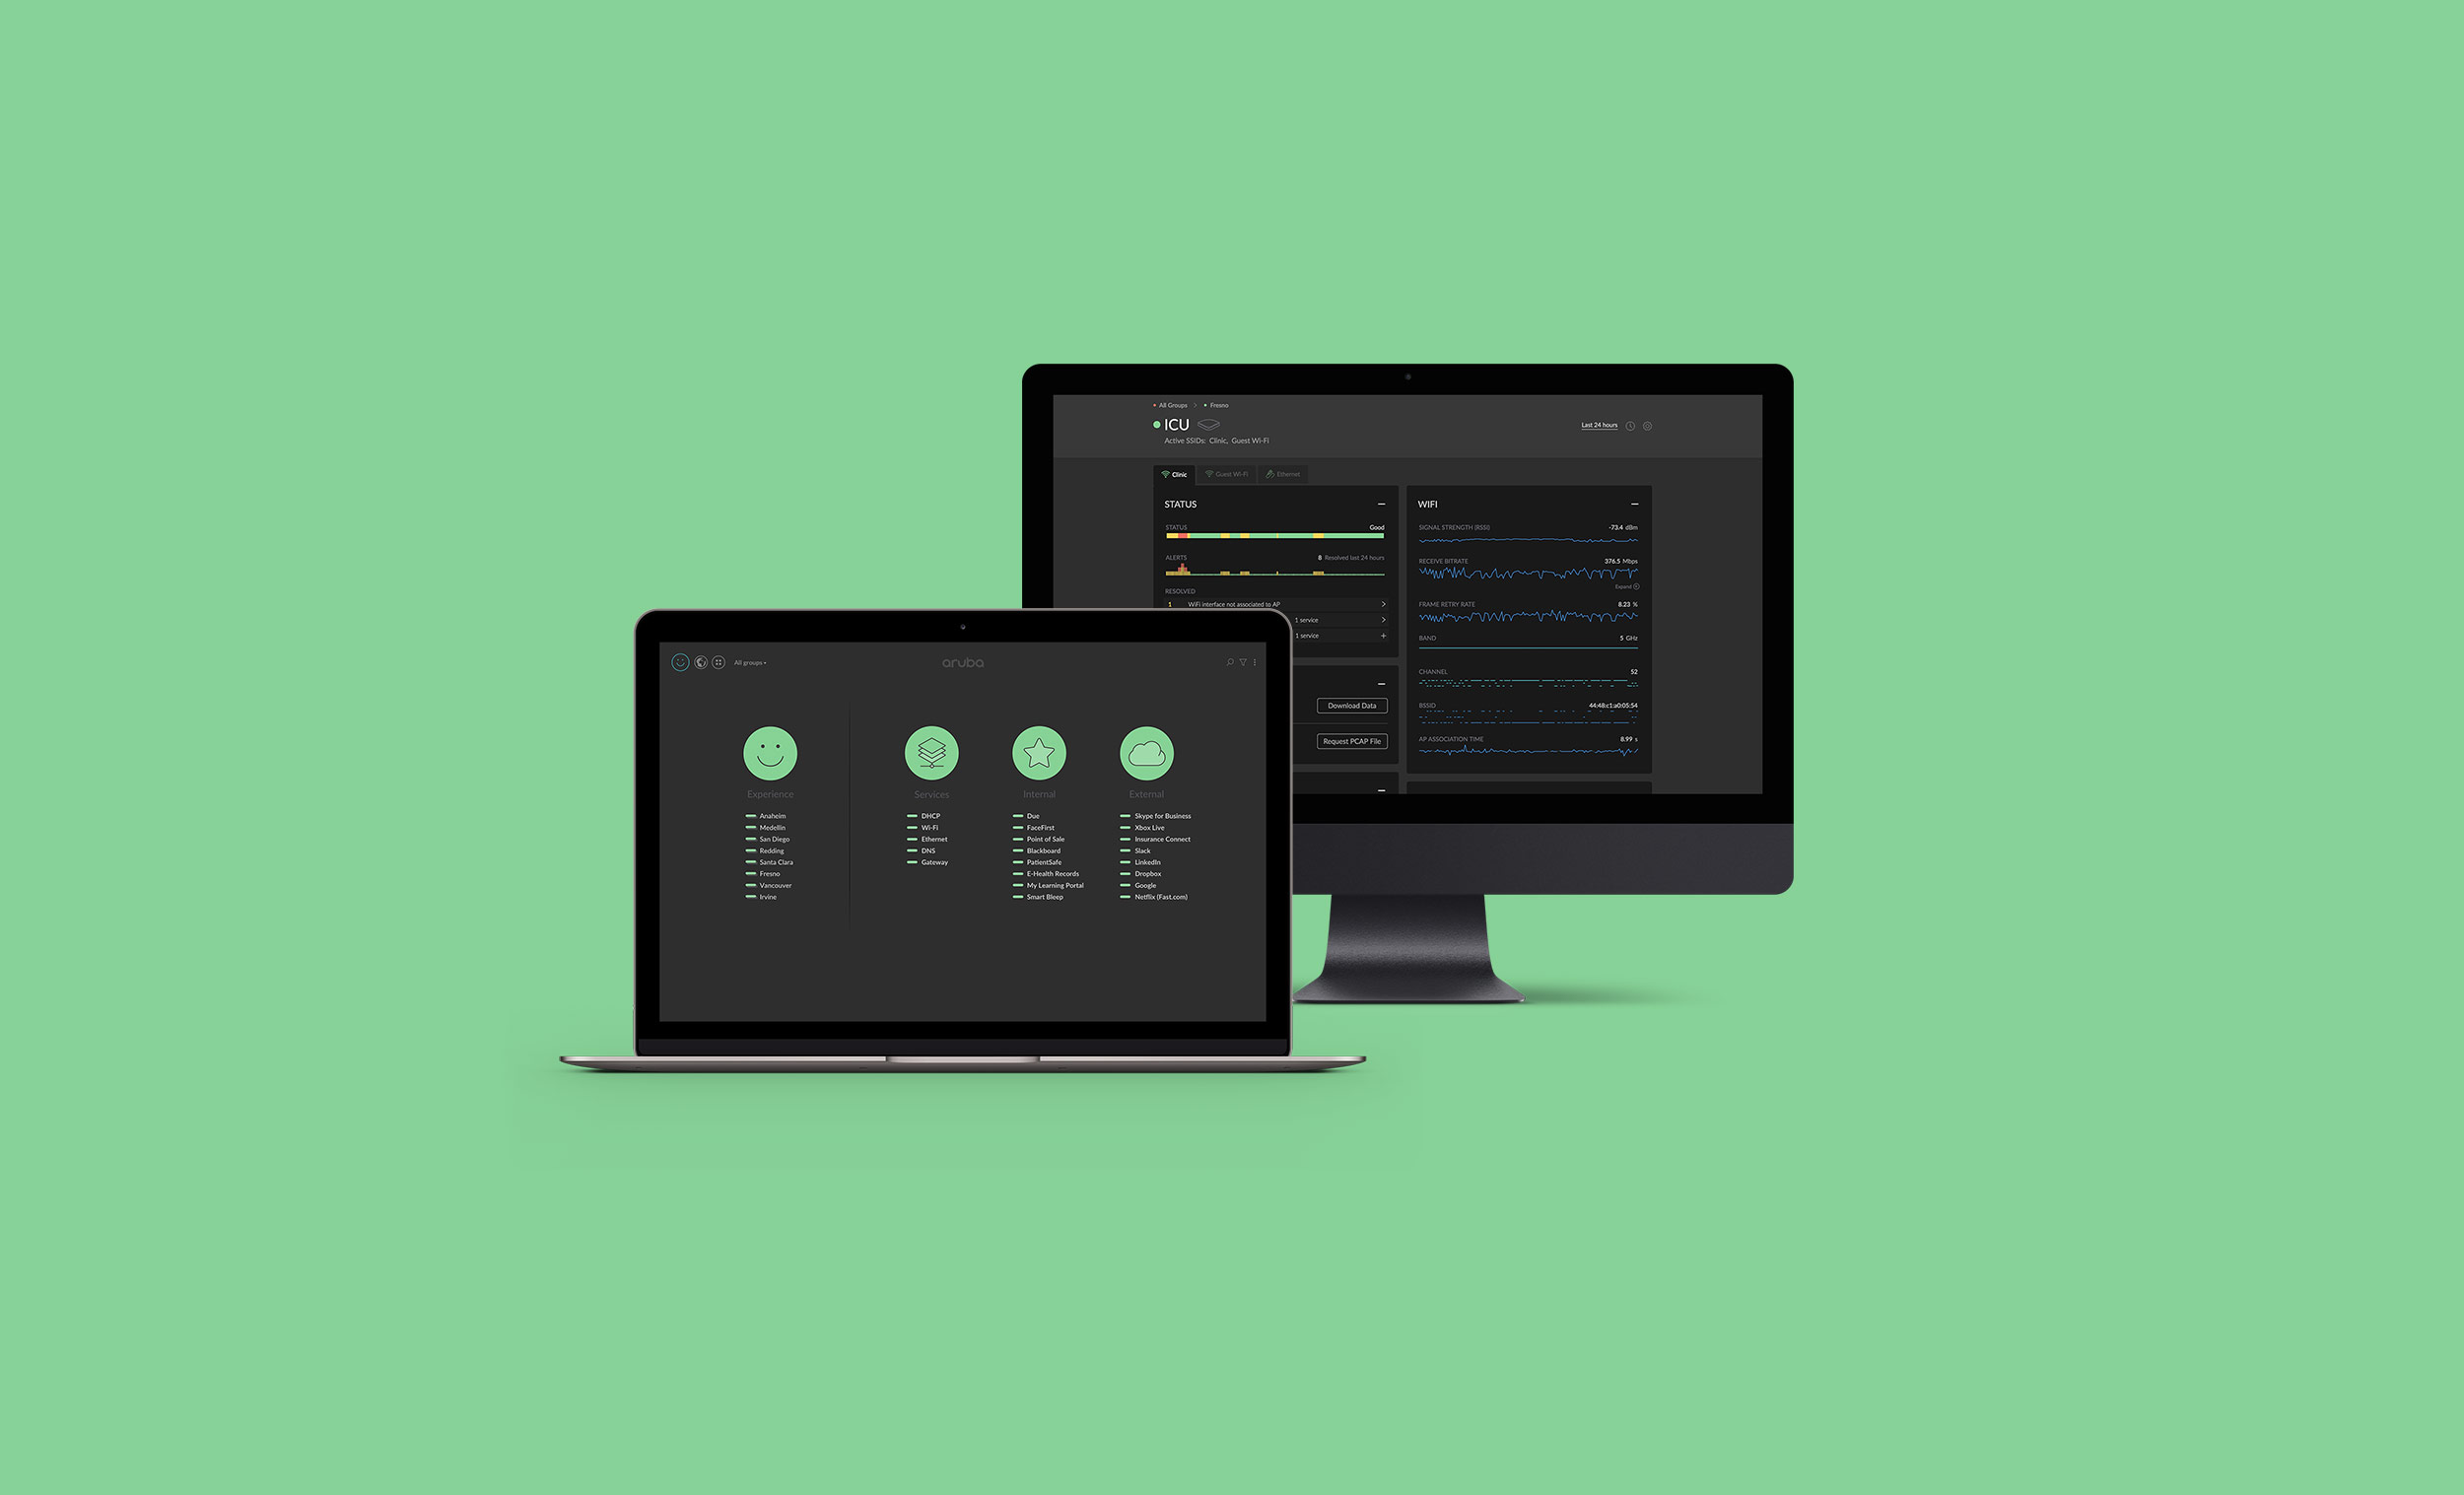
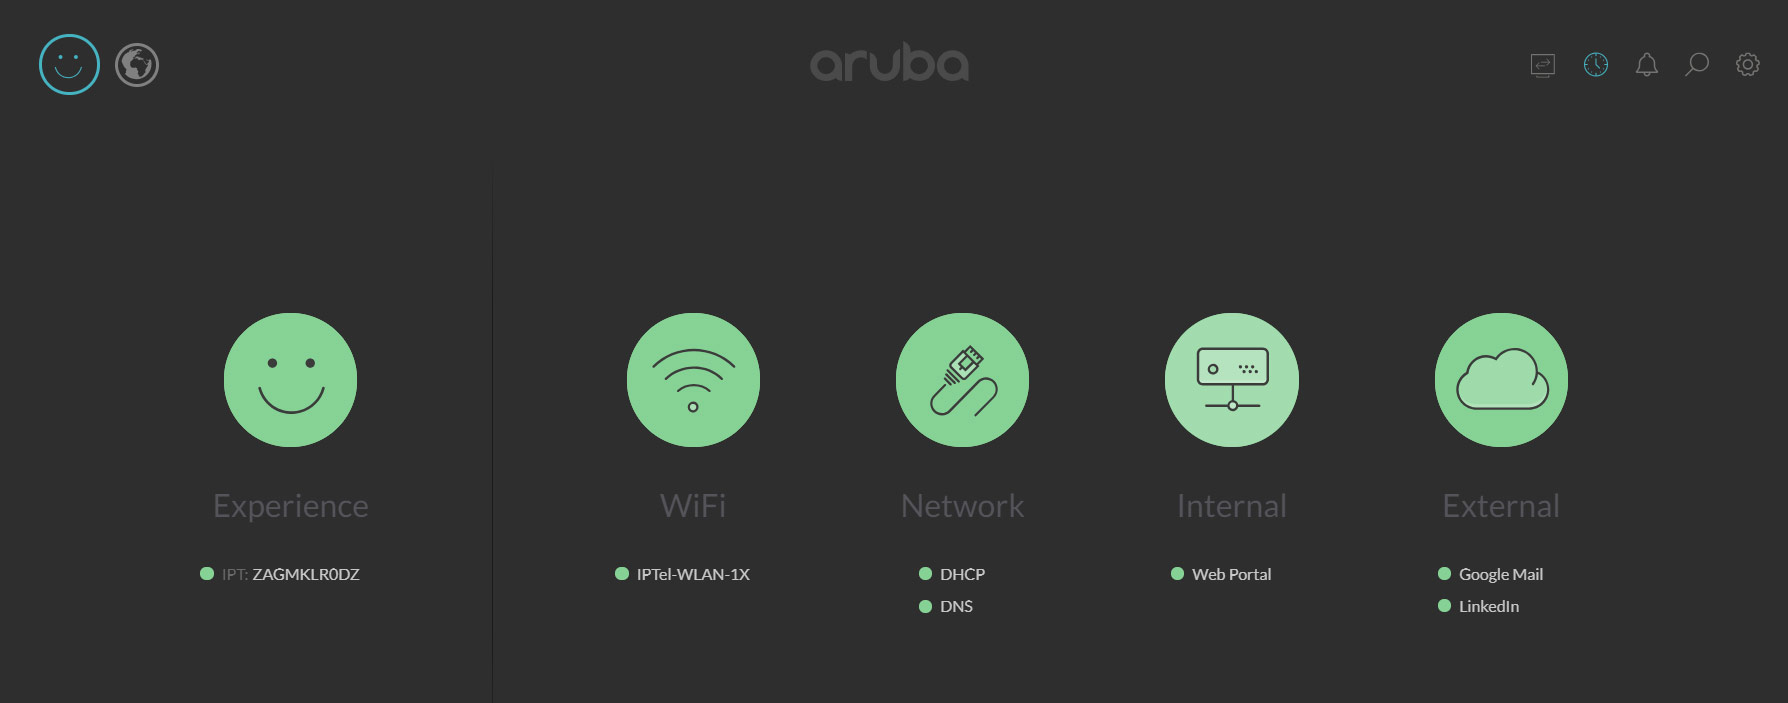
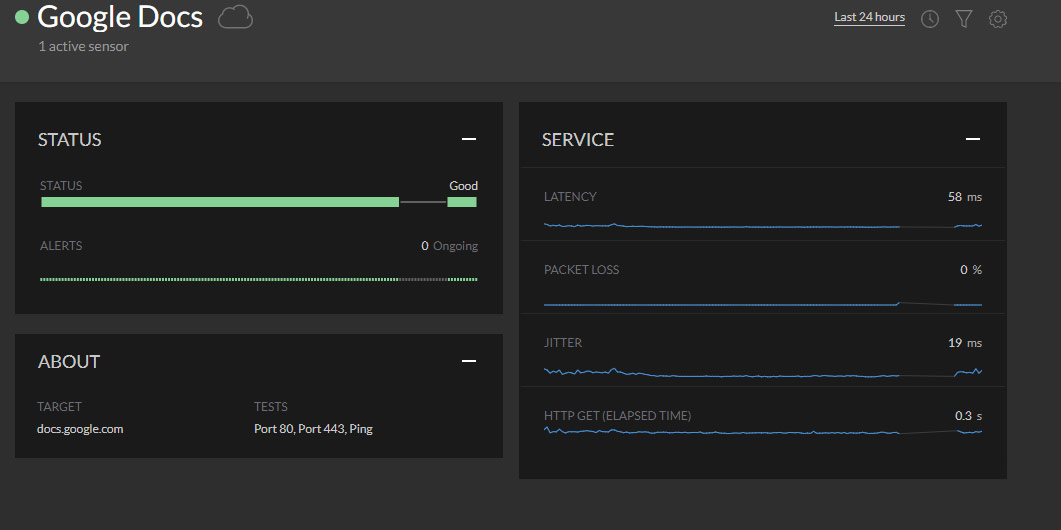
The dashboard is simple and easy to use. It gives you access to a lot of information about your network. Hover over any piece on the home page to get alert info. Then, click to drill down further and see a trove of other information, such as signal strength, channel, response times for things like dns or dhcp, even websites if you set them up.

The sensor can be configured to check both internal and external services. Whether you use internal websites and fileshares, or Google docs and Microsoft OneDrive, you can test them all to be sure they are up and running. If they aren’t, the IT department is the first to know.
Proactive Alerts
Alerts are sent via email whenever certain customizable thresholds are met. This enables IT departments to know about a problem before a user has a chance to report it. They will also know exactly what went wrong without having to hunt around for the cause of the issue.
The alert says which service is down. Quickly letting IT know if the entire internet is down, or if its just the DNS service on a server. Website issues can also be shown through the alerts. Knowing exactly whats wrong, quickly enables the IT department to address the issue faster. This results in less down time and less unhappy users.
Cloud Accessibility
The dashboard and all data are hosted in the cloud. This allows for you to access it anywhere, at any time. No need to be on site to diagnose an issue. No worries about not being able to see data and alerts while a site is down.
Diagnosing issues is half the battle in the helpdesk world. Eliminating this problem, enables the IT department to be far more efficient and timely in resolving those issues.
Location, Location, Location
Arubas UXI sensor should be placed in a spot where wifi is used most, or problem areas that you would like more information on. It comes with a couple different ways to mount it. It can also be set on a desk or table just as easily.
A secure mounting bracket can be deployed in public areas without the fear of it disappearing. All it needs is power either provided by the included power adapter, or by a PoE solution. The sensor also isn’t just limited to wifi. It works over ethernet as well, so you can check all network connections at once.
A user experience sensor is a valuable tool for any company, small or large. The key feature is that it enhances the response time of any IT department. Faster response times mean less downtime, which means less time your company is running smoothly. The solution is constantly being updated with more features being added every day to make the jobs of you and your IT department easier.
Contact Zunesis for more information on this solution or other networking products for your organization.
Categories
Search
Blog Categories
Related Resources
Archives
- July 2024
- June 2024
- May 2024
- April 2024
- March 2024
- January 2024
- October 2023
- September 2023
- August 2023
- July 2023
- June 2023
- May 2023
- April 2023
- March 2023
- February 2023
- January 2023
- October 2022
- July 2022
- June 2022
- May 2022
- April 2022
- March 2022
- February 2022
- January 2022
- December 2021
- November 2021
- October 2021
- September 2021
- August 2021
- July 2021
- June 2021
- May 2021
- April 2021
- March 2021
- February 2021
- January 2021
- December 2020
- November 2020
- October 2020
- September 2020
- August 2020
- July 2020
- June 2020
- May 2020
- April 2020
- March 2020
- February 2020
- January 2020
- December 2019
- November 2019
- October 2019
- September 2019
- August 2019
- July 2019
- June 2019
- May 2019
- April 2019
- March 2019
- February 2019
- January 2019
- December 2018
- November 2018
- October 2018
- September 2018
- August 2018
- July 2018
- June 2018
- May 2018
- April 2018
- March 2018
- February 2018
- January 2018
- December 2017
- November 2017
- October 2017
- September 2017
- August 2017
- July 2017
- June 2017
- May 2017
- April 2017
- March 2017
- February 2017
- January 2017
- December 2016
- November 2016
- October 2016
- September 2016
- August 2016
- July 2016
- June 2016
- May 2016
- March 2016
- February 2016
- January 2016
- December 2015
- October 2015
- September 2015
- August 2015
- July 2015
- June 2015
- May 2015
- April 2015
- March 2015
- February 2015
- January 2014
- February 2013


